Home care · B2B SaaS
UX design for complex home care operations
Turning dense operational data, business rules and interdependent workflows into clear, implementation-ready interfaces.
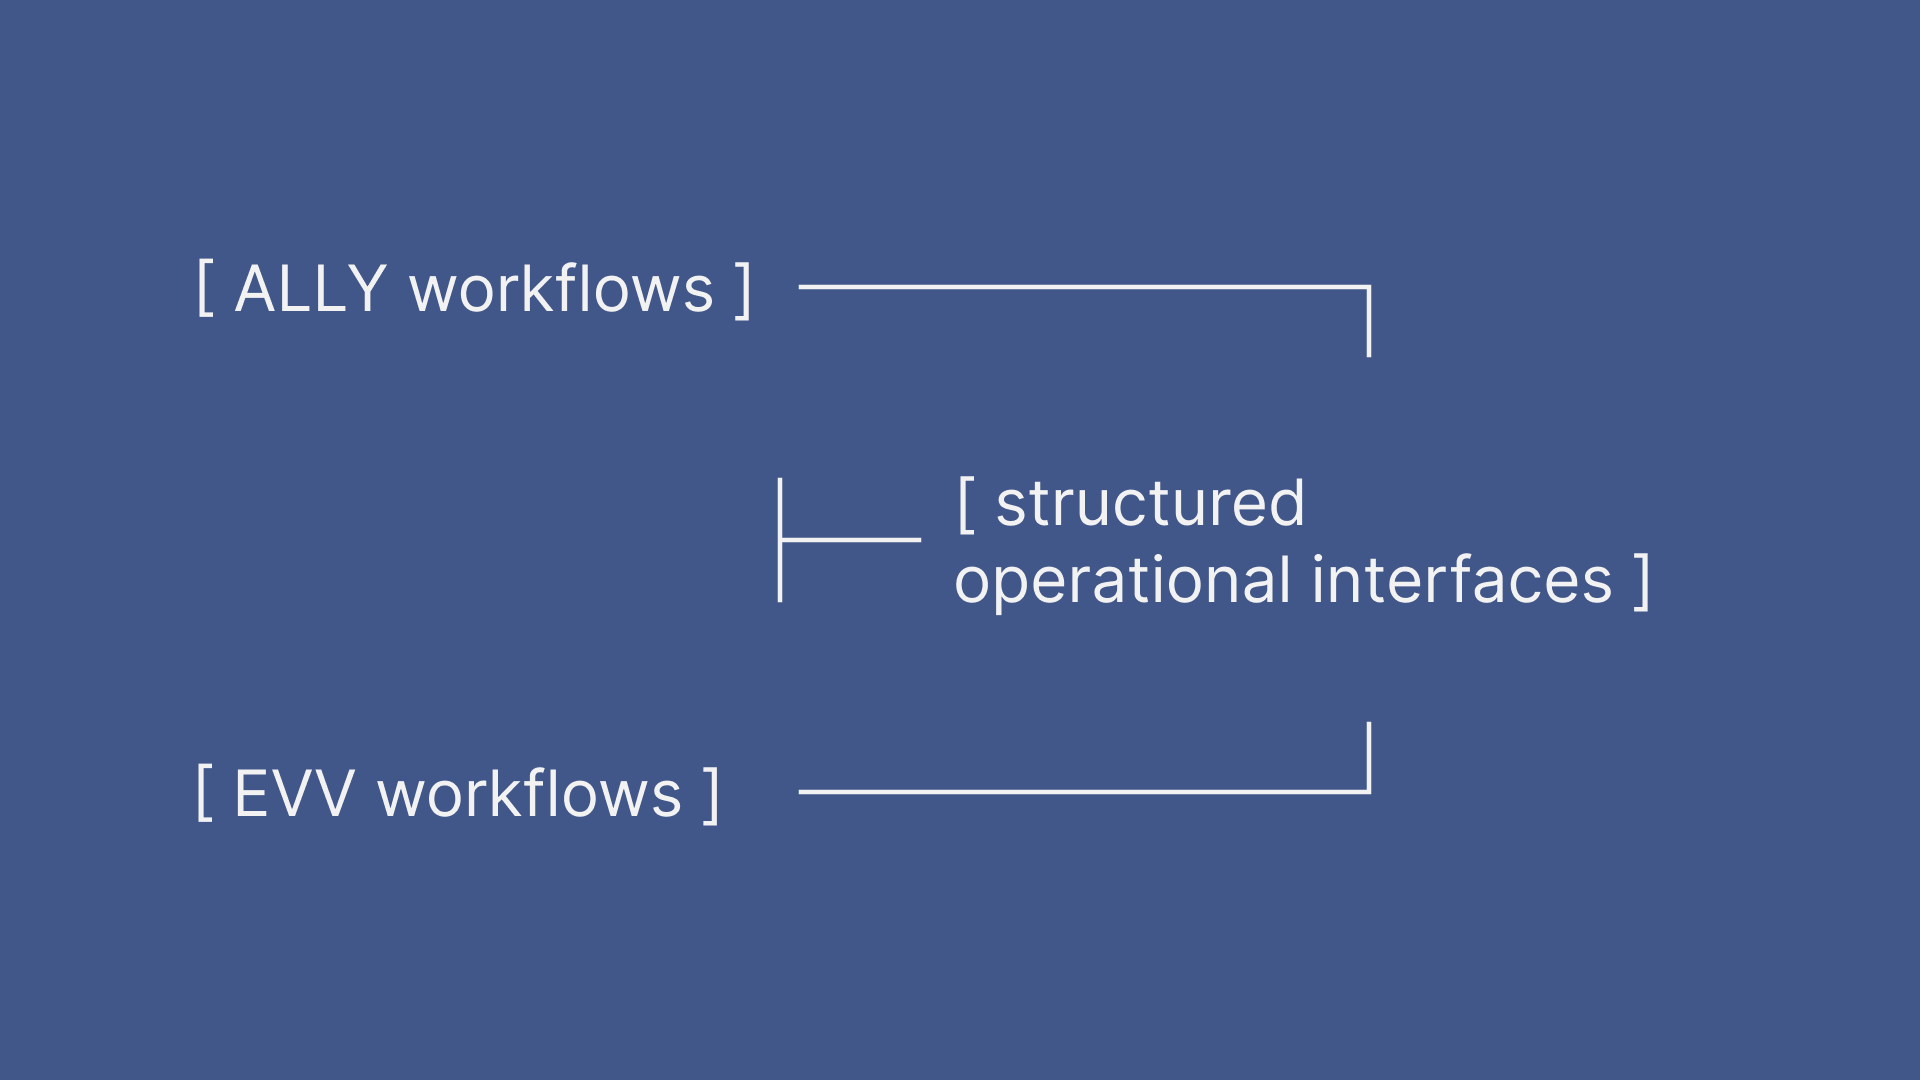
Project context
- Client and product
- Ally MS · Ally platform · US HealthTech B2B SaaS for home care operations, electronic visit verification, billing and insurance claims.
- My role
- UX Designer responsible for client-facing discovery, system mapping, workflow design, low-fidelity UX and delivery coordination.
- Team and ownership
- Two UX Designers shared discovery, workflows and low-fidelity design. A UI Designer owned the UI Kit and final visual design.
- Timeframe
- May–November 2023.
- Engagement
- System mapping, UX modernisation and workflow design aligned with the development roadmap.
- Core constraint
- Required operational data and business rules could not simply be removed or changed.
Designing within a larger operational system
Ally is an operations and billing platform built for US home-care registries working with independent caregivers. It supports client and caregiver records, scheduling, visit verification, payment processing, caregiver payments, insurance claims and reporting.
Selected Ally and EVV workflows needed to be mapped and modernised ahead of scheduled development sprints. We clarified dependencies with domain experts and translated them into clearer information hierarchies, interactions, system states and low-fidelity UX flows.
Challenge
Extensive operational data, strict rules and linked records had to remain understandable without losing necessary context.
Validation
Designs were reviewed with product stakeholders, administrators, superadmins, engineers and sales specialists.
Delivery
Completed UX flows were handed to the UI Designer and prepared for implementation against the development roadmap.
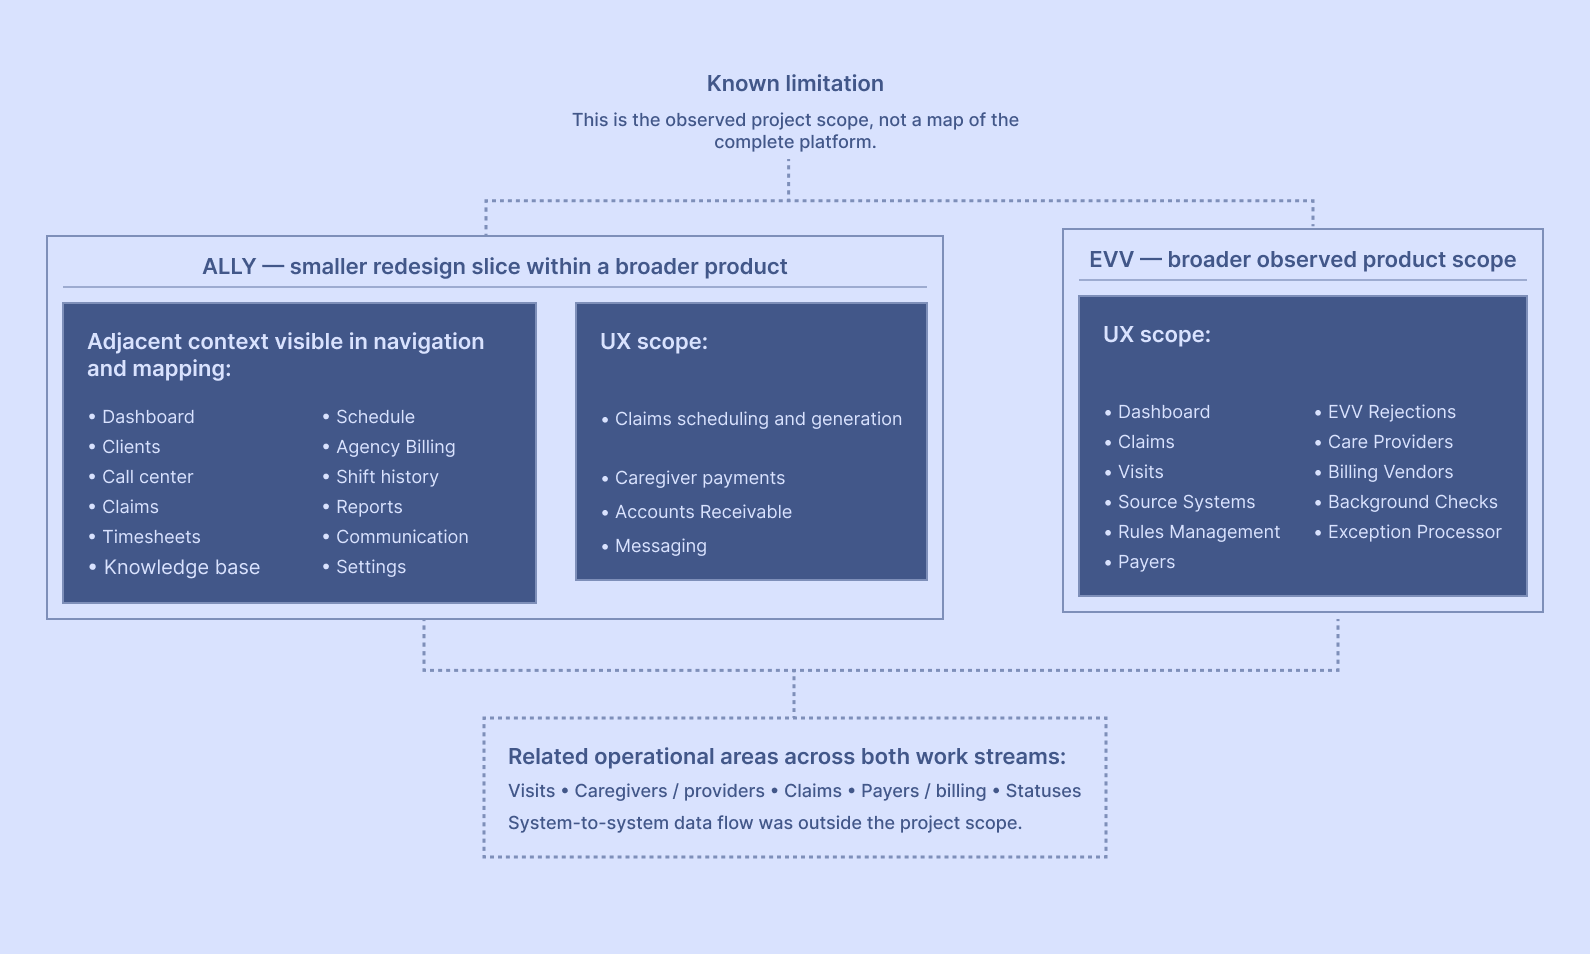
The section of the system we explored and redesigned
Selected workflows within a much larger operational platform were mapped for redesign, with adjacent functionality reviewed only as needed to understand data, rules, states and downstream dependencies.
System complexity across records, rules and lifecycle states
Each interface exposed a larger system of records, rules, states and downstream consequences. The operational logic and required data had to remain intact, while the interface had to make dependencies, validation and next actions understandable.
Before simplifying the Visit view, we decomposed the existing interface and documented the relationships and open questions that shaped the redesign.
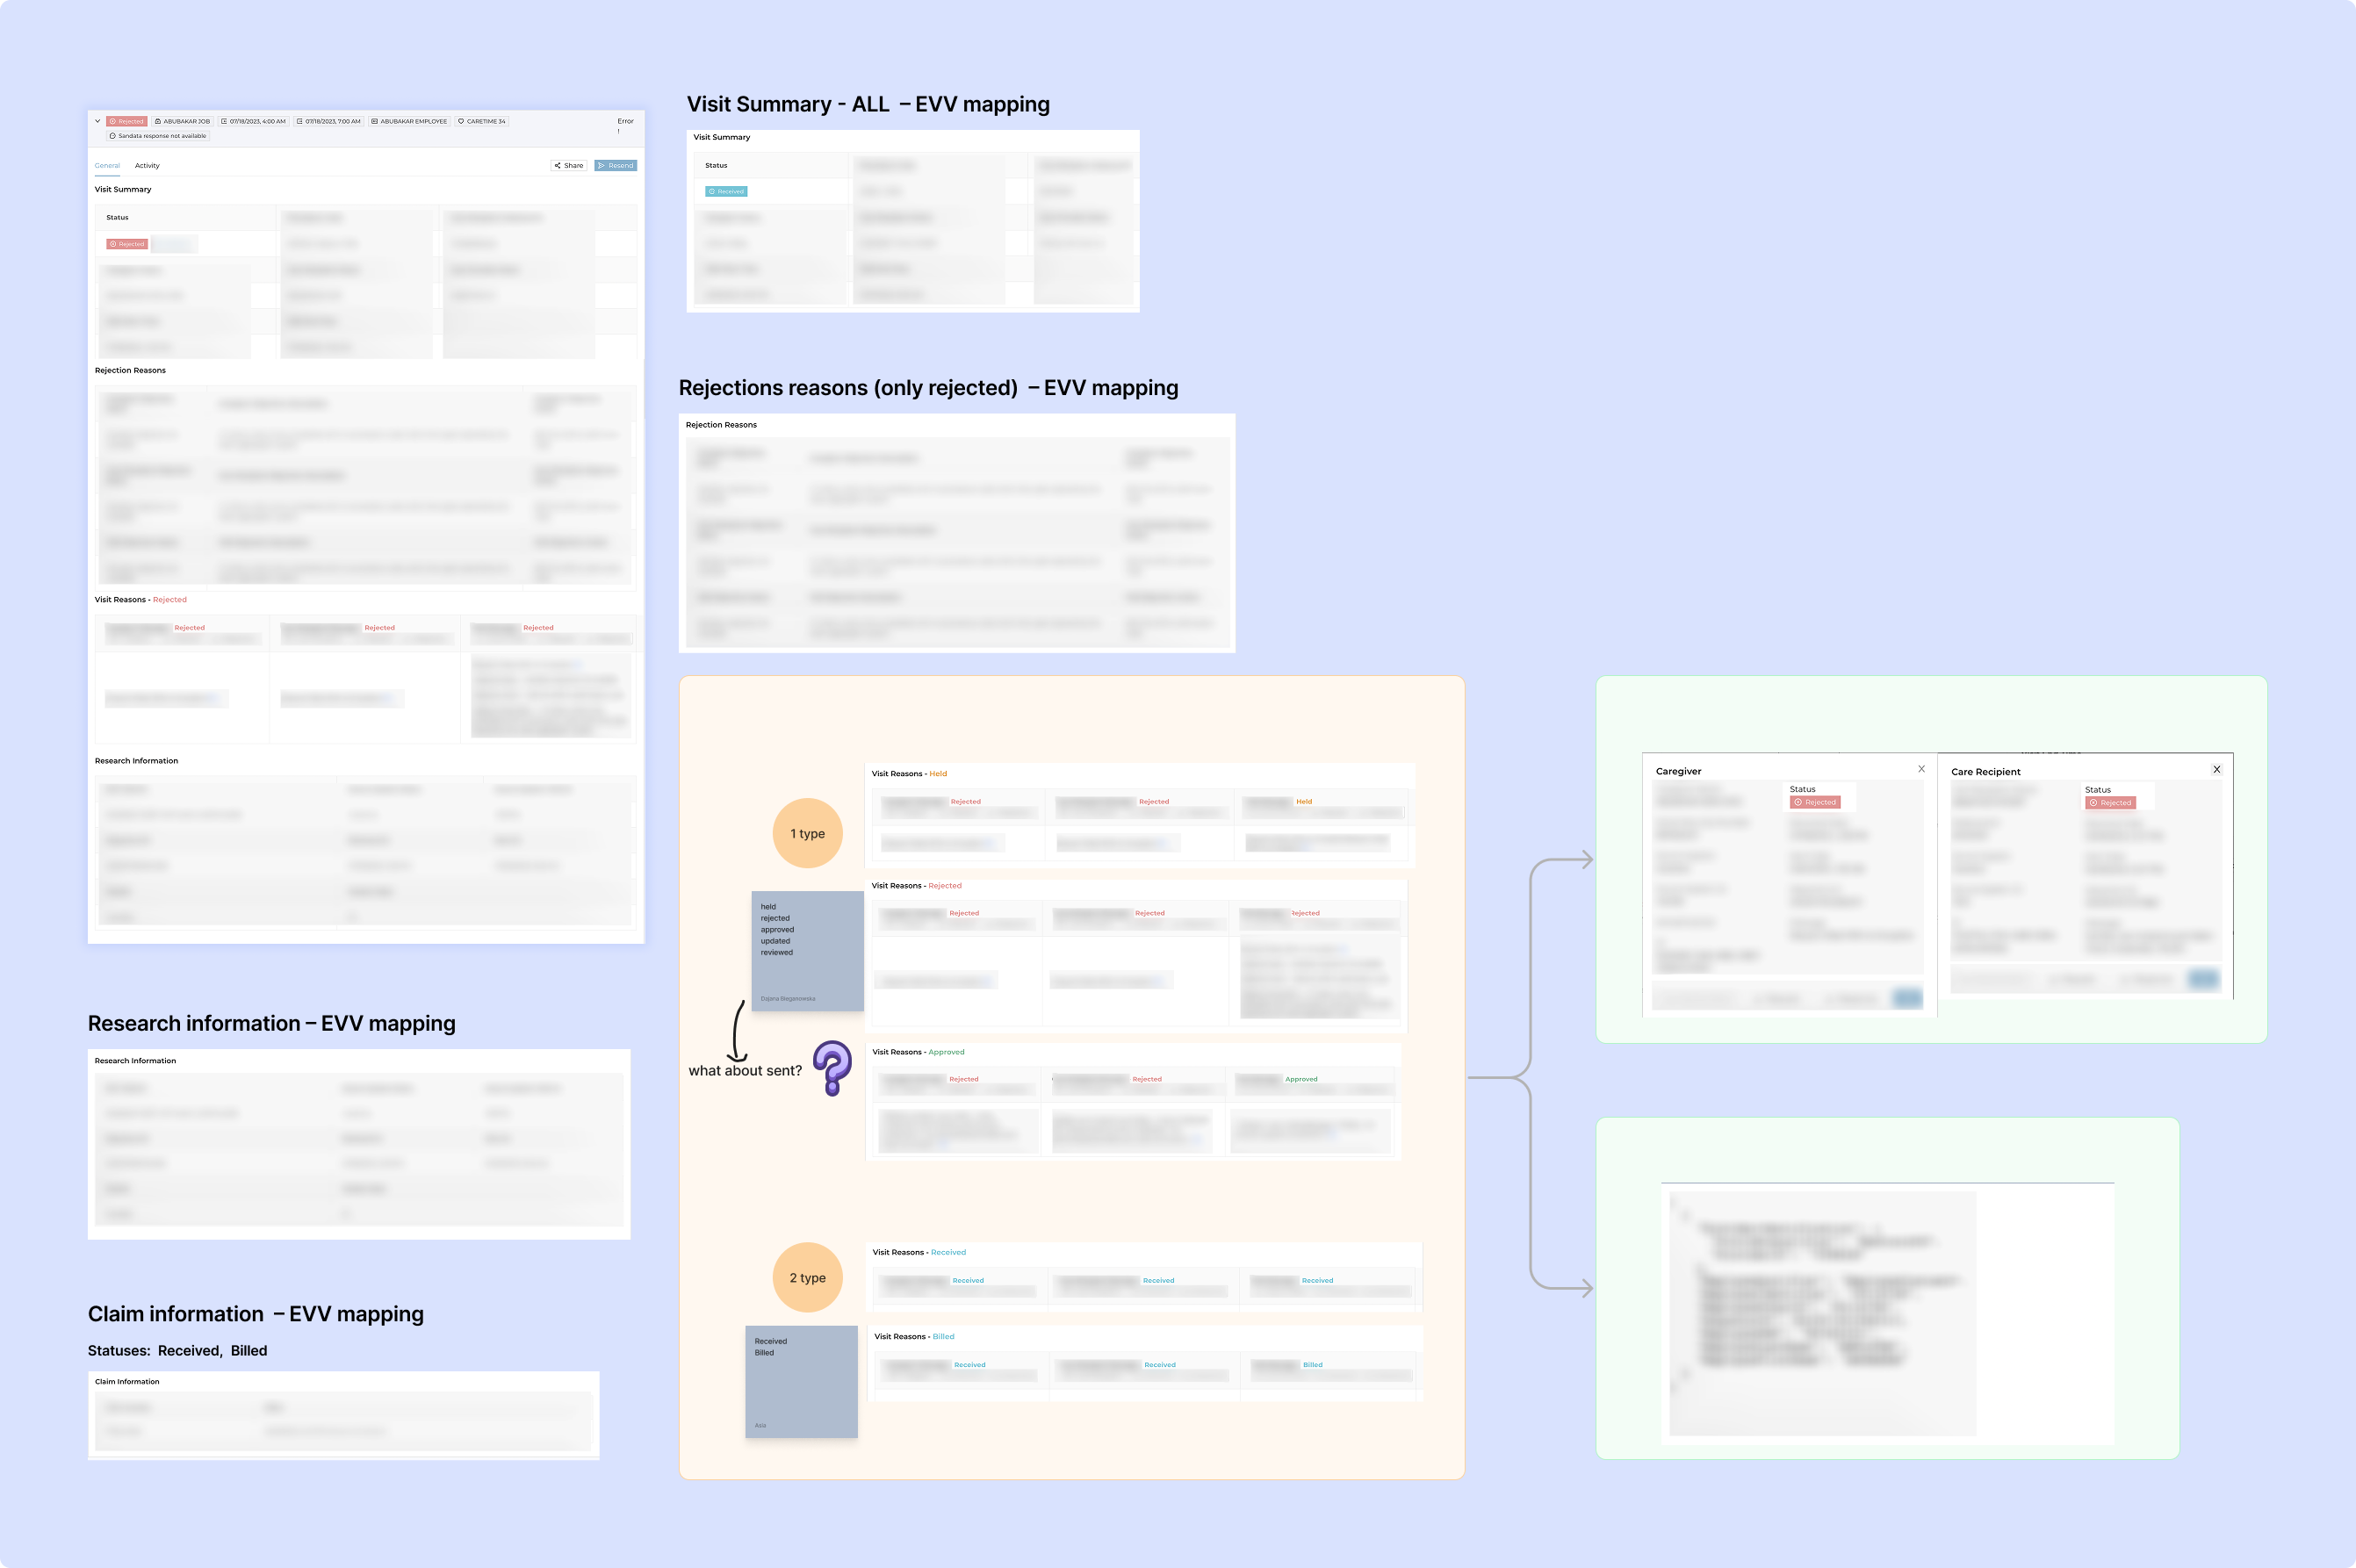
Reducing information density without losing operational meaning
The Visit details view had to combine operational states, related records, rejection context and recovery actions. Early low-fidelity versions included the full diagnostic layer within the same expanded record.
The challenge was to decide what needed to remain visible, what could move into linked detail and how to preserve the context required for action.
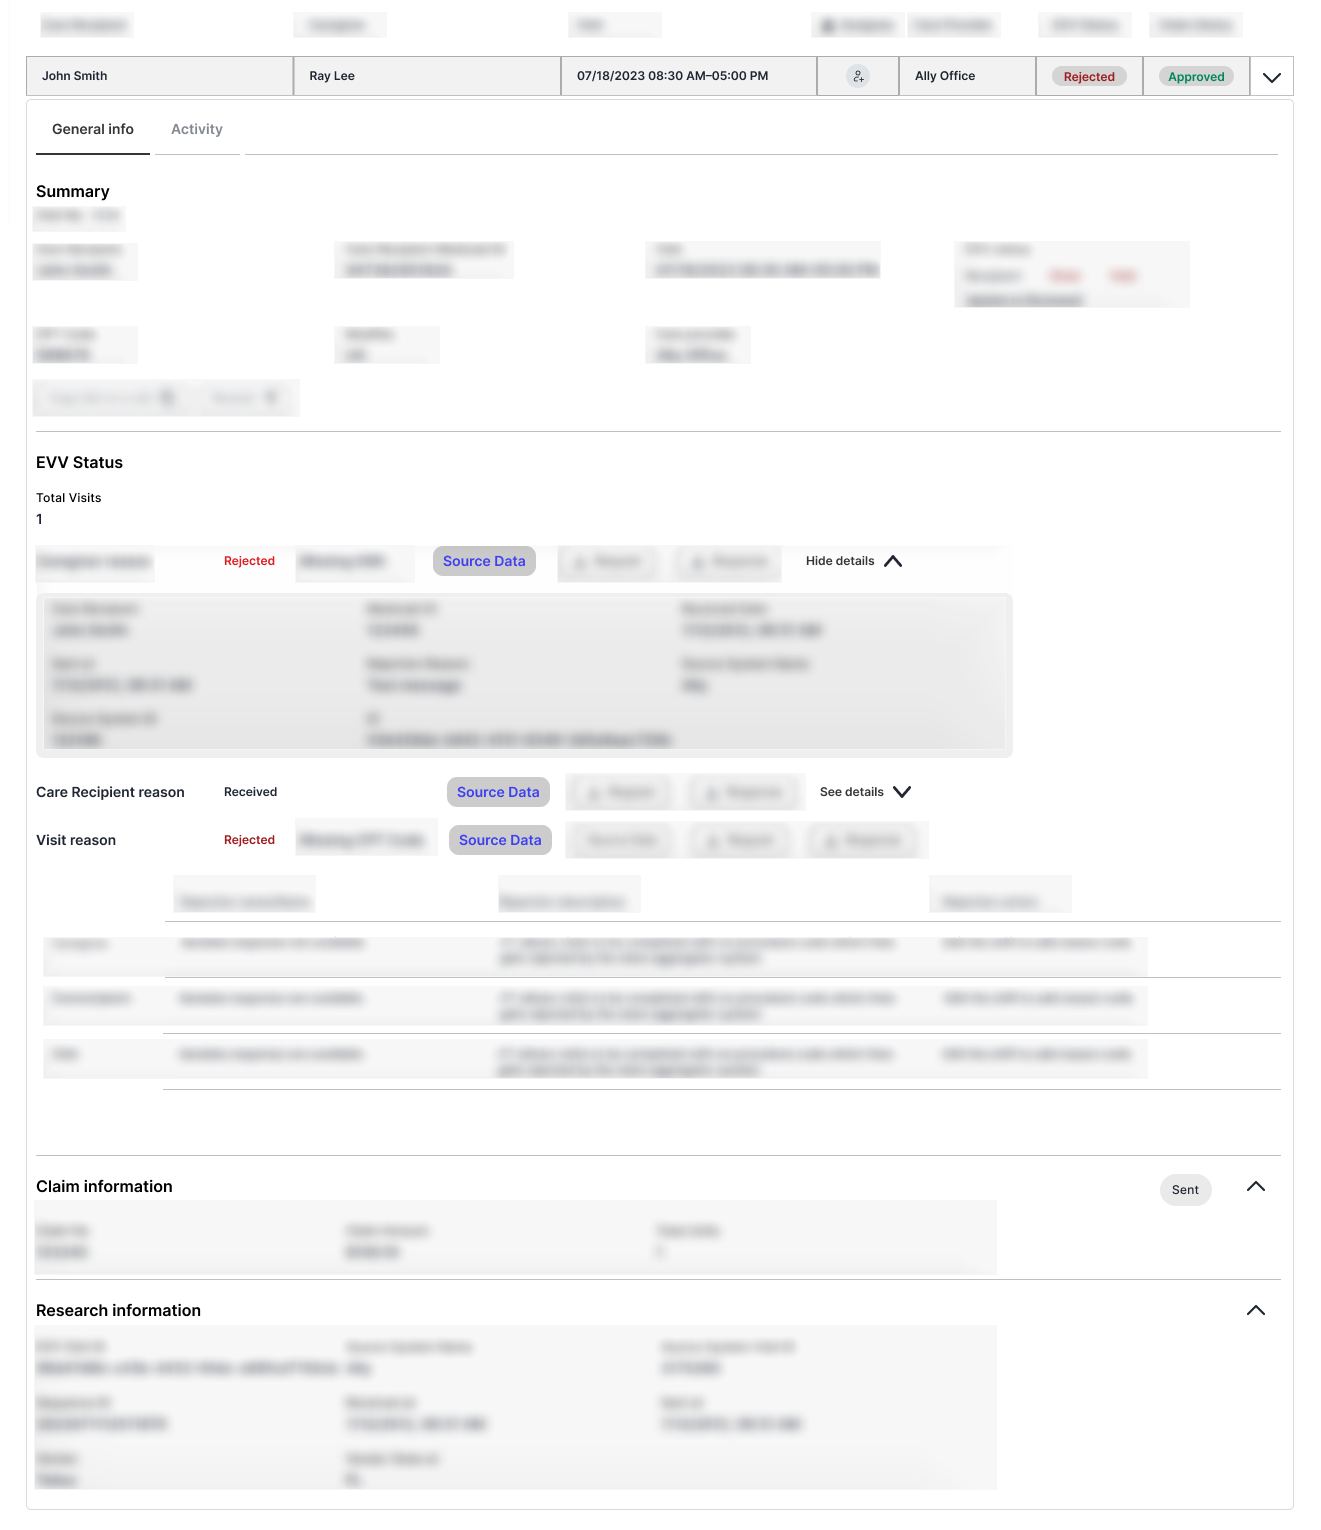
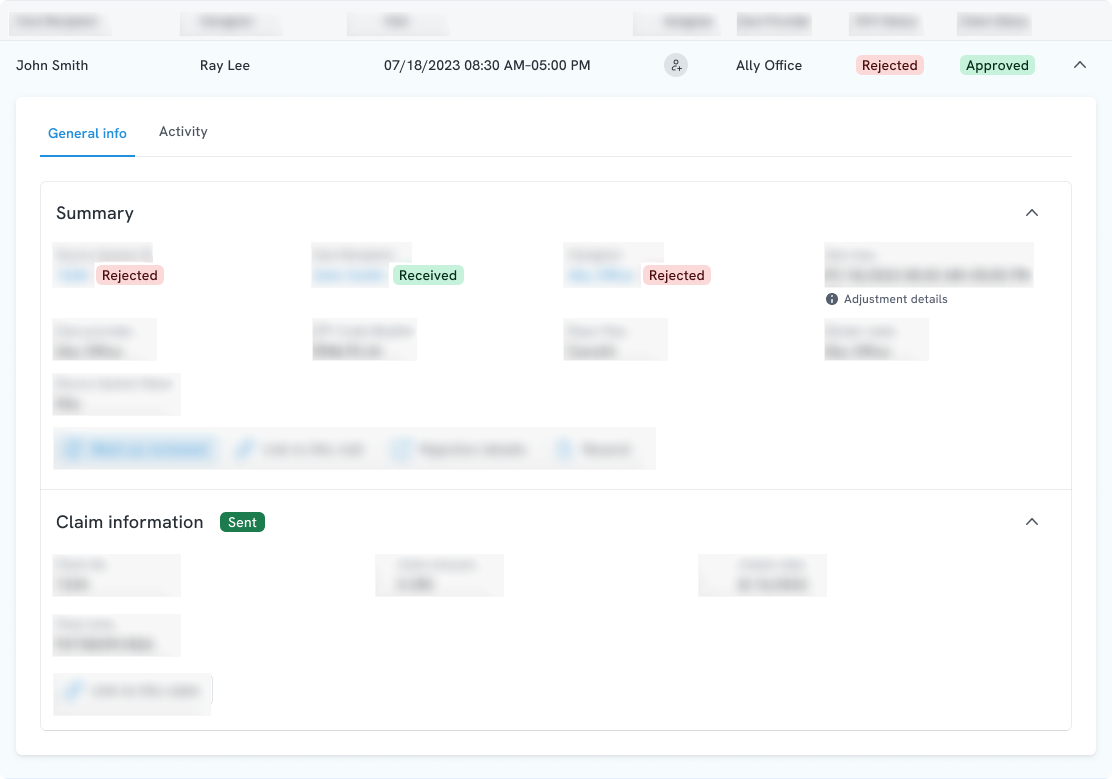
The two UX Designers explored grouping, progressive disclosure and action hierarchy. The Product Manager made the final decision about which system information and functions could be omitted. The UI Designer translated the agreed low-fidelity direction into the final visual interface.
Multiple processing states
A Visit could surface several independent processing states at the same time. They could not be collapsed into one universal status without losing the meaning of where an issue occurred and what could happen next.
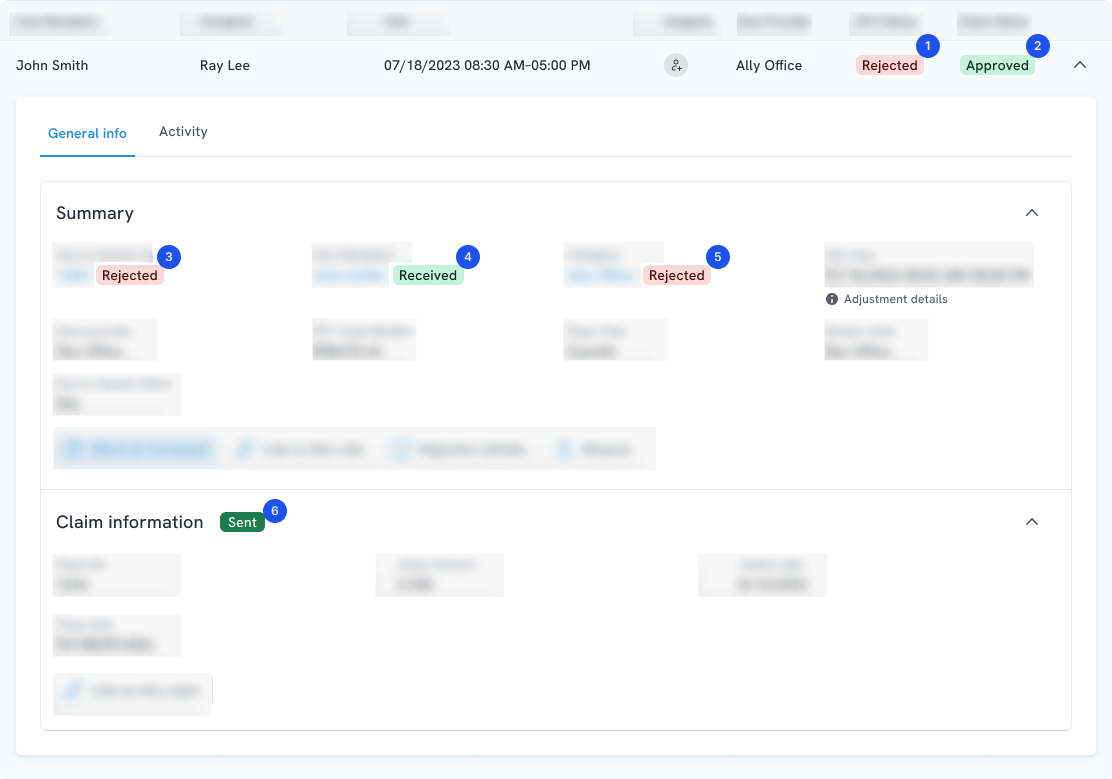
- 1–2 Primary row states.
- 3–5 Related states inside the expanded summary.
- 6 Downstream processing state.
Validation changed with the workflow stage
Profiles could be created with the minimum information required to begin and completed later. Rules evaluated additional requirements when the data became necessary in the workflow.
- Requirements could apply at different intervention points rather than at account creation alone.
- Missing or invalid information could trigger a warning, prevent an operation or create an exception, depending on configuration.
- Administrators needed enough context to identify the affected record and continue or resolve the process.
Designing a multi-level Accounts Receivable workspace
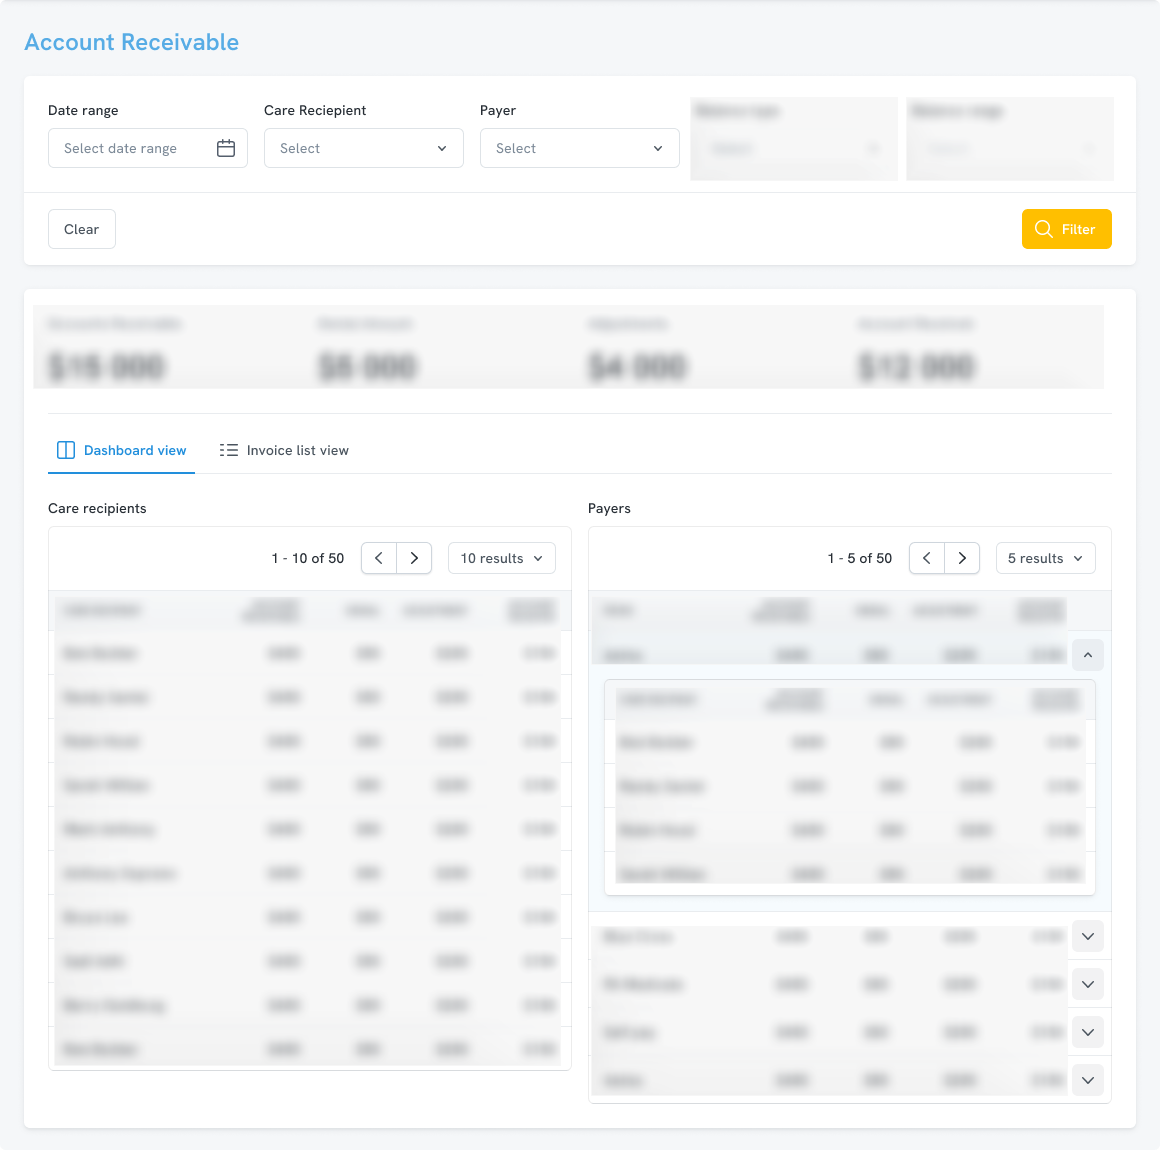
Accounts Receivable brought several levels of financial information into one operational workspace: account-level totals, balances grouped by care recipient and payer, invoices, service details, transaction history and payment allocation.
Our task was not to redefine the financial rules. It was to let administrators move from an overview to a specific invoice or transaction, understand the scope of an action and keep the surrounding account context visible.
One workspace, two aggregation perspectives
The dashboard supported two ways of finding the same receivables: through care recipients and through payers.
Keeping transaction history in context
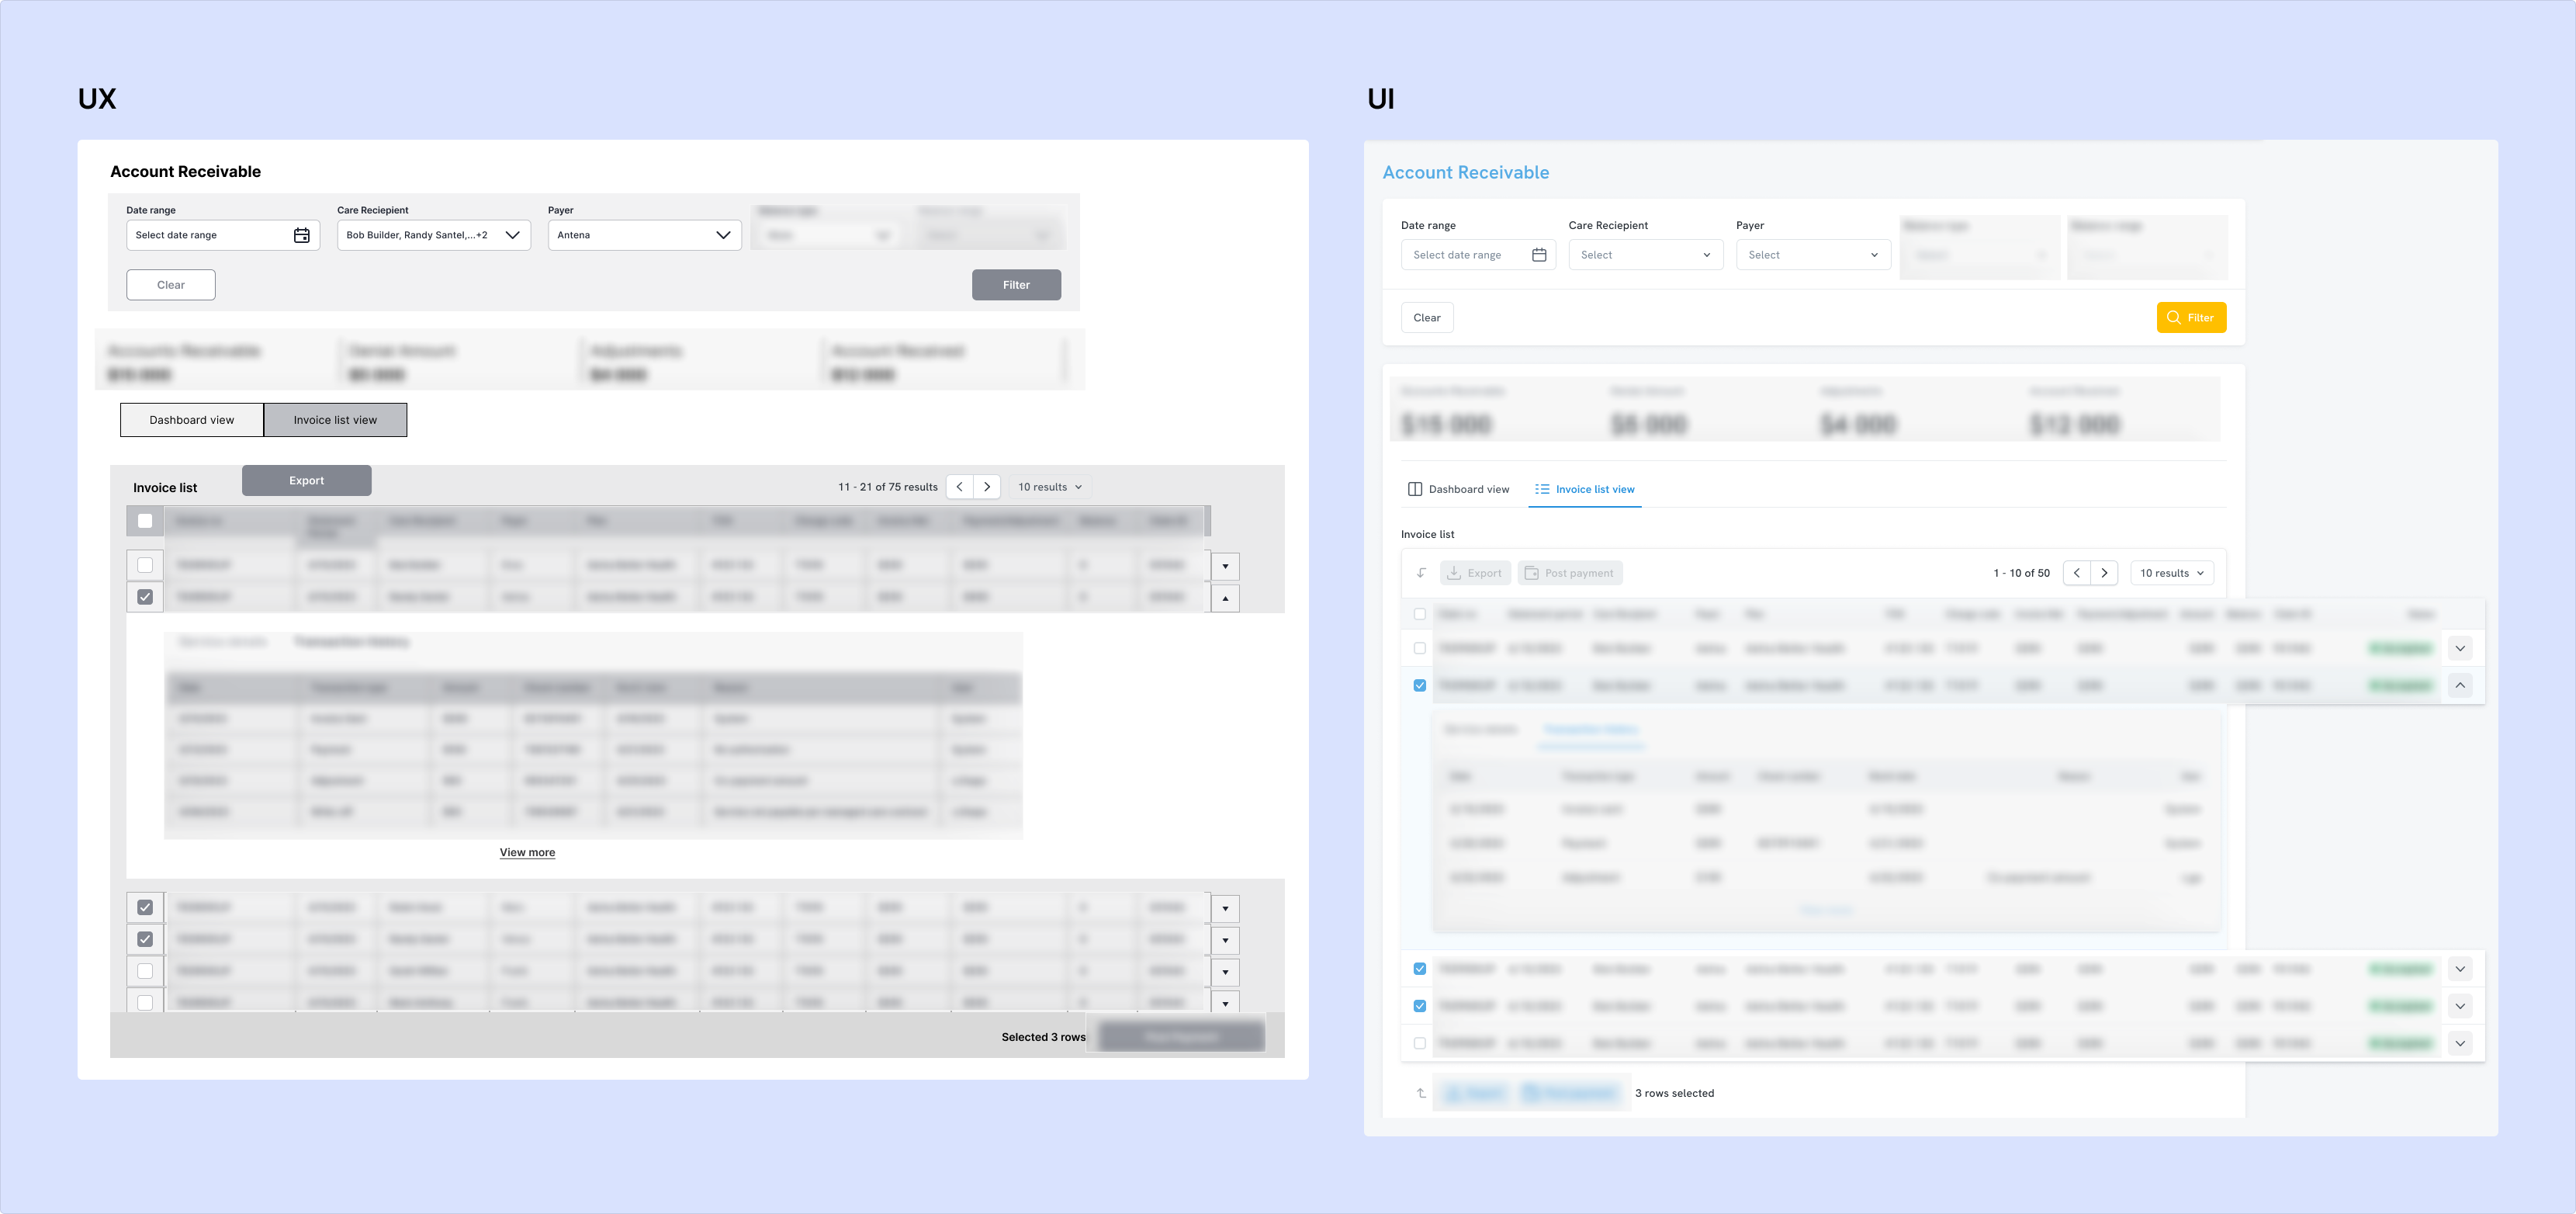
An invoice connected account-level data with service details and a history of payments, adjustments and other billing events.
The UX and final UI retained the same interaction model: select an invoice, expand it in place, then switch between Service details and Transaction history. This kept the parent invoice and surrounding records visible while exposing deeper information only when needed.
Making payment allocation visible
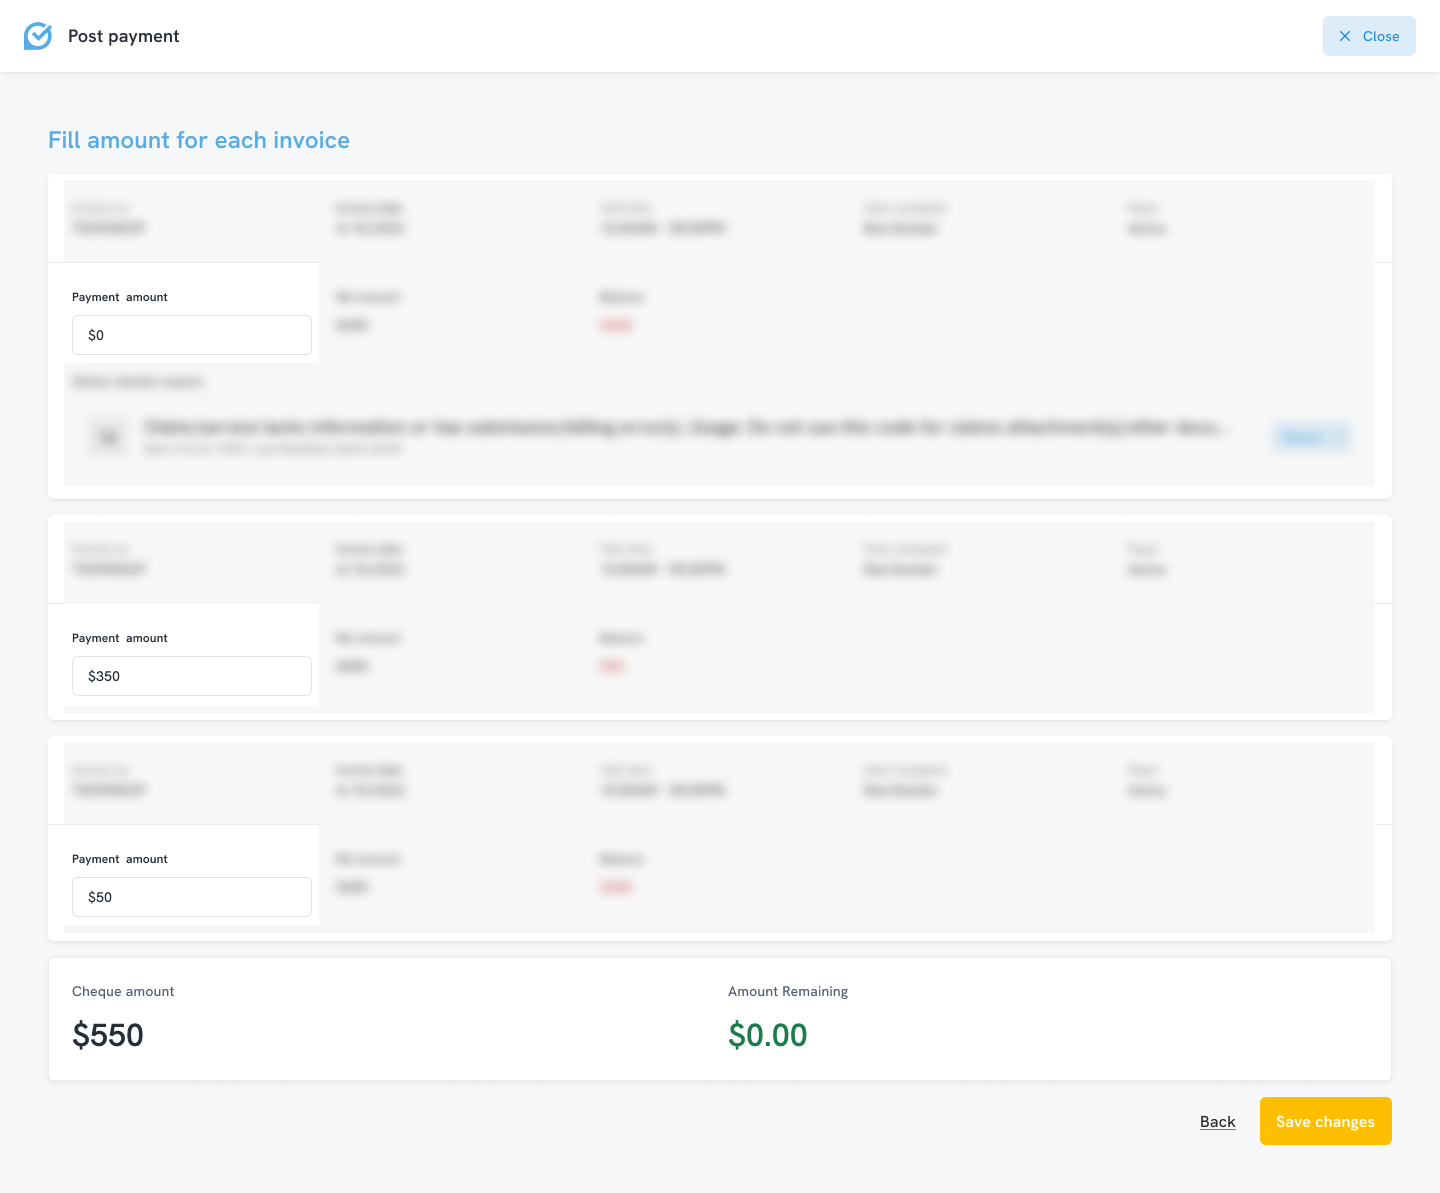
After selecting invoices, an administrator could assign an amount to each one while keeping the total cheque amount and amount remaining visible. Additional exception handling appeared only where an individual invoice required it.
Supporting pattern
Turning parameters into a guided setup
An early claims-automation concept presented cadence, frequency and execution times as a parameter-led form. We reorganised the setup around three questions: What time? How often? And, for a weekly cadence, What days of the week?
Conditional controls appeared only when relevant, while a readable summary made the schedule explicit before saving. A compact status message then kept the active cadence and last completed run visible.
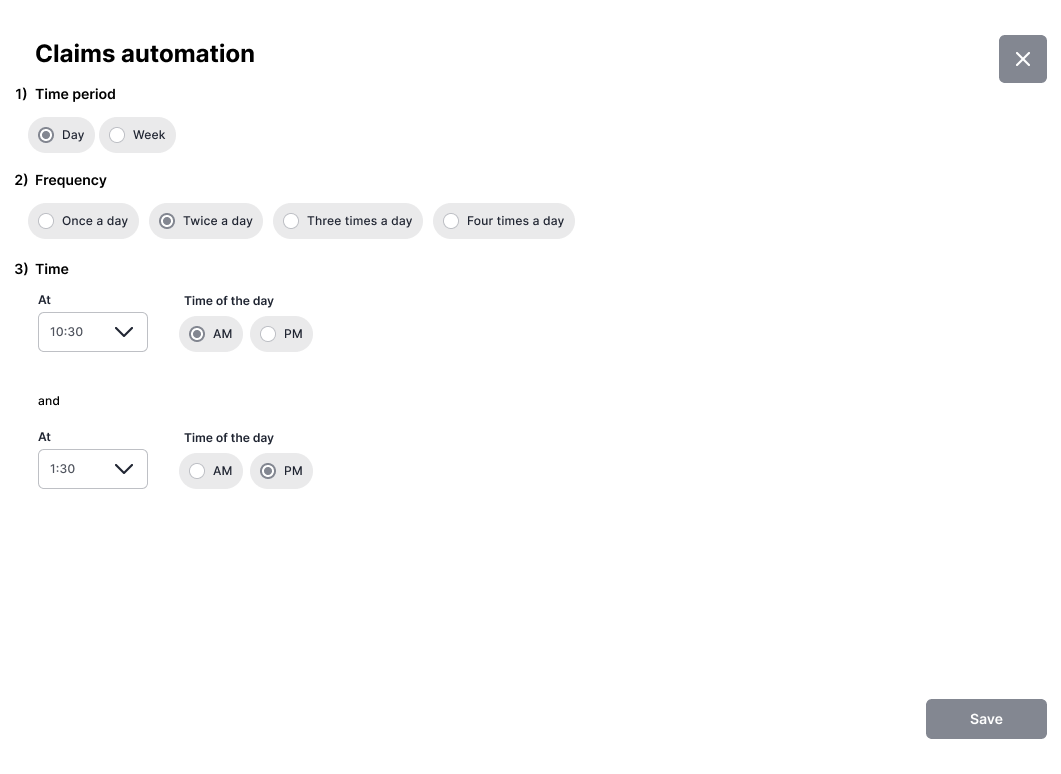
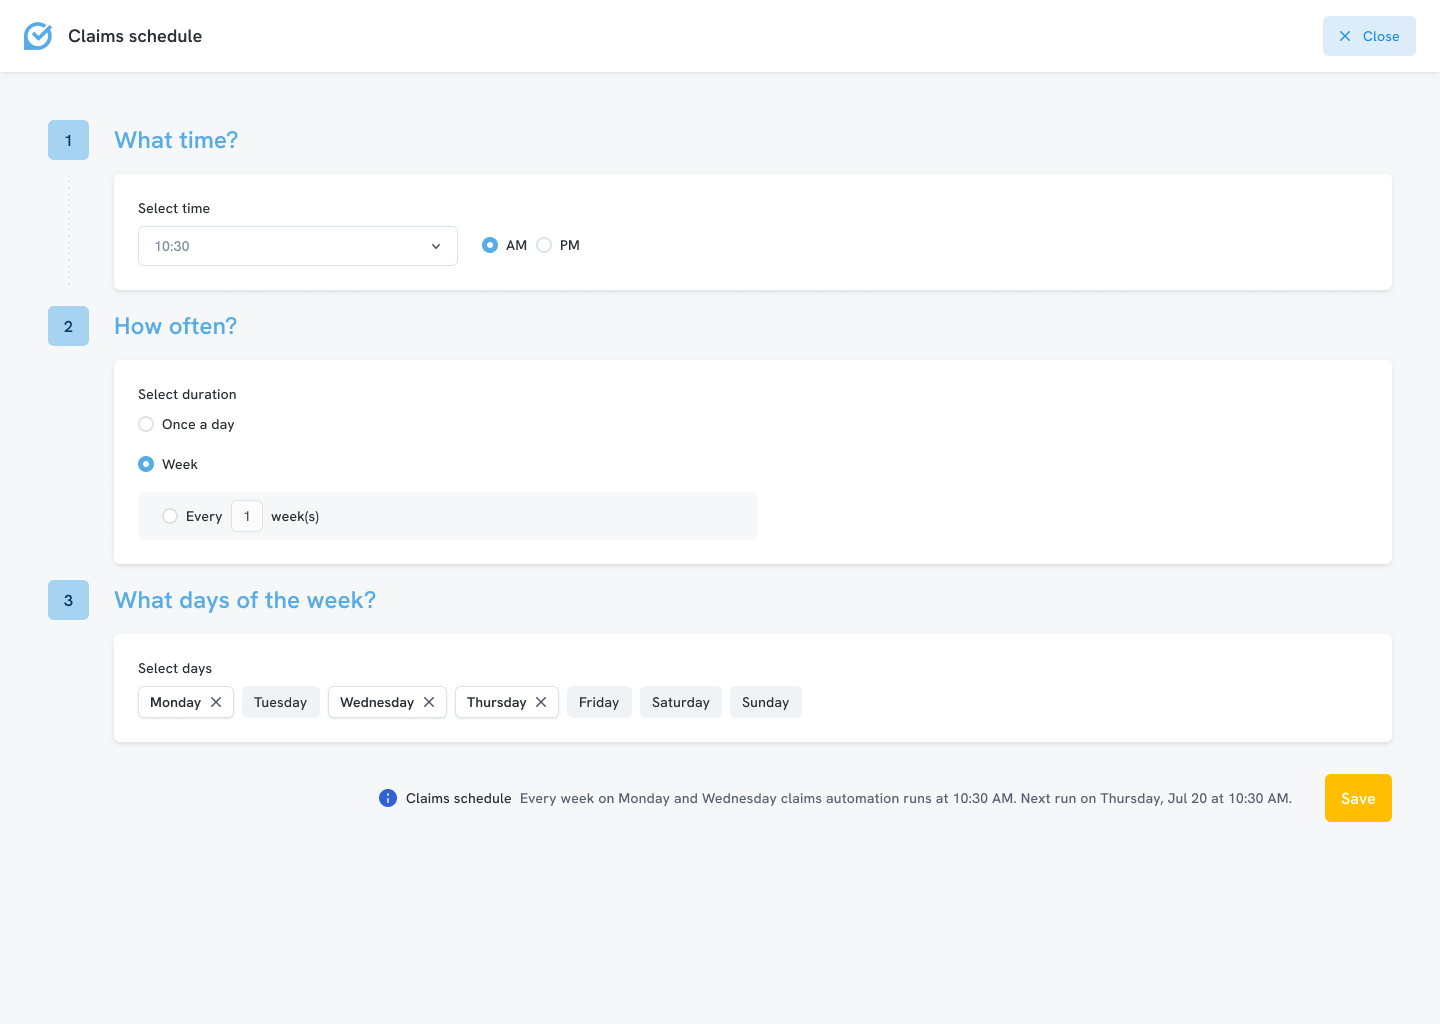

The configuration evolved from a parameter-led form into a guided setup with conditional inputs, a readable schedule summary and persistent status feedback.
Reflection
This project reinforced that design practice has to adapt to the complexity of the product. In a system shaped by business rules, integrations and backend constraints, progress depended on learning from people who understood the system deeply, then translating that knowledge into a usable interface model.
My role was to turn specialist knowledge into clear information hierarchy: distinguish actionable from informational data, editable from read-only content, expose the right states and links, and reduce information density without hiding the operational context required for decisions.
Evidence boundary
The case study covers selected workflows rather than the complete platform. Without direct access to commercial end users or verified outcome metrics, the evidence is limited to expert and stakeholder validation, approved UX direction and final delivery.